I wrote about CSR for ‘small businesses’ in February 2019, touting it as an opportunity to win new customers, attract employees and improve your local community when it was still voluntary.
The legislation only affected large businesses that were trading and niche businesses that were pioneering this. Of course, I wasn’t the only one to present this as an opportunity and the idea of thinking about it has become commonplace, but not always for the right reasons.
The ultimate aim remains to reduce the impact, ideally to be regenerative to compensate for years of abuse of our planet’s resources. This would enable our children to enjoy the same quality of life as we do, right?
Many companies are not yet ready and will not act until the regulator pushes them to move forward in reducing their environmental and social impact. The CSRD regulation is one such regulation.
From 2025, for 2024 data, more companies will have to report on their CSR impact or their supplementary financial reporting. For example, almost five times as many companies will have to report on their non-financial impact in Germany, from 11,000 to 50,000 entities. And the report is no longer a separate report; it must be integrated into the financial report and checked by the auditors like any other element.
Why does it matter?
“You can’t improve what you don’t measure.“
Simply asking companies to include non-financial elements reinforces the need to expose their current practices. This is an enormous opportunity to visualise the real impact of their activities in terms of environmental and social impact, both internally and externally. It is only when they can imagine their current position in the market that they have the opportunity to position themselves in their own sector, and surprises can emerge.
From this panorama, a new style of competition can emerge to take the lead in the field of sustainability; and this will not be long in coming. and governments have a card to play to encourage virtuous companies and motivate regenerative behaviour. Ambition will, I hope, be the keystone of progress.
What will the reports cover?
The three pillars of CSR (environment, social and governance) are included, but at the time of writing, the definitive standards have not been published. Nevertheless, it is clear that the following topics should be covered:
Environment : Pollution, use of water and marine resources, circularity (including waste management) and resources used, biodiversity (such as land use and impact on land) and impact on ecosystems.
Social: Workforce, value chain workforce, affected communities, consumers and end-users.
Governance: Corporate governance.
How do you get started?
For those who have already started, it would be a matter of understanding what is expected to enter the official report (it will be digital), and perhaps filling in the gaps.
For those who haven’t started yet, this is an excellent opportunity to develop the company’s future-proof vision, involving stakeholders to work together to develop the best approach to get there. Drawing up a clear picture of current practices, opportunities, pain points, risks and bottlenecks, and selecting the SDGs that the company wants to address in line with its core values, sets the stage for successful progress.
What’s next?
As mentioned earlier, this is only the beginning of the journey, the company must use this new regulation not as a limitation but as an opportunity to move the company into the future. This needs to be understood by stakeholders, which means promoting the approach and gaining support internally (employees and management) as well as externally (community).
(employees and management) as well as externally (community, customers and suppliers, trade unions, authorities and professional and civil associations).
For the sake of future generations, it is quite positive to approach these changes with goodwill and vision.
This post is a part of a presentation initially written in French, and presented during the monthly reunion of the collective I organise with one of my dear friend Julie Goudet. We bring together the french community in Hamburg to provide Educational talks and trainings about Sustainability and protection of the biodiversity.
The food sector in industrialised countries is like that friend who never changes – it’s been contributing around 24% of greenhouse gas emissions, and it seems to be sticking to that number. However, in developing countries, the situation is a bit more positive. Thanks to some changes (and maybe a bit of finger-pointing elsewhere), their share has dropped to 39% in 2015 from a whopping 68% in 1990. China, Indonesia, the United States, Brazil, the European Union, and India top the list for the highest volumes of emissions. Yes, we’re looking at you, China and the US – time to cut down on those food-related emissions!
The way we consume our favourite treats plays a huge role in shaping the world we live in.
According to the United Nations climate and environment report, our beloved food systems are responsible for more than a third of global greenhouse gas emissions. Now, that’s some food for thought!
Supply Chains and Packaging:
Now, let’s dish out some shocking stats. Fresh/cold supply-chain activities are responsible for around 5% of global food system emissions, and that number is on the rise. But wait, it’s not just what’s on your plate that’s causing a stir. Turns out, your food’s packaging is a real troublemaker, accounting for 5.4% of global food system emissions. That’s right – more than what it takes to get your groceries from farm to fork. Maybe it’s time to rethink that extra layer of plastic wrap?
Avoiding Food Waste:
Moving on to another guilty pleasure – wasting food. The Waste Report 2021 revealed a staggering 931 million tonnes of food wasted globally. In the UK, 30% of vegetable crops are left to wither away simply because they don’t meet our aesthetic standards.
France isn’t any better, with each French person tossing out 20 to 30 kilos of food annually, including 7 kilos still in its packaging. Ooh la la, that’s a lot of edible treasures going to waste!
Tips to Tackle Food Waste:
So, how can we turn the tide on this food waste epidemic? Fear not, we’ve got some tasty tips for you:
Embrace Ugly Veg: Remember, the ugly ones taste just as good. It’s time to break free from the tyranny of perfect-looking produce.
Plan Your Meals: A little bit of meal planning goes a long way. Know what you need and stick to it – your wallet and the planet will thank you.
Storage Wisdom: Follow the instructions on the packaging to keep your food fresh. It’s like giving your fridge a PhD in food preservation.
Disco Soup Party: Turn leftovers into a feast! Host a Disco Soup party with friends, music, and all the food scraps you’ve collected. Let’s make leftovers cool again.
Decode Dates: Understand the difference between “use-by” and “best before” dates. Spoiler alert: that chocolate turning white doesn’t mean it’s gone bad.
Embrace Anti-Waste Apps: Get on board with apps like “Too Good To Go. » or other food waste avoidance app It’s like a treasure hunt for discounted food, and you’re saving the planet while you’re at it.
There you have it – a crash course in sustainable eating and avoiding food waste. Let’s be mindful of what we put on our plates, and together, we can make a world of difference, one delicious meal at a time. Happy eating!
In 1907, the first plastic based on a synthetic polymer appeared: bakelite, rigid and insulating, invented by Leo Baekeland, a Belgian-American chemist. In 1908, cellophane was born, flexible and transparent, and the number of inventions increased as plastic became more widespread. In the space of a century, plastic has invaded our lives and provided many services to medicine and mass production. So why is it such a big problem?
Why is plastic a problem?
No plastic is biodegradable!
Non-biodegradability: Plastics take hundreds of years to decompose, leading to a long-term accumulation of waste.
Remember the principle: biodegradation in two stages:
Bio-fragmentation → products form tiny pieces under the effect of the elements (water, sun, wind, etc.)
Bio-digestion → the small pieces (or fragments) are digested by soil micro-organisms to become basic elements again: water, CO2, methane and non-toxic residues.
Micro-organisms cannot digest plastic fragments.
Plastics can be toxic in use and for nature:
Plastics, even food plastics, release particles when heated and/or when they decompose, which can contaminate heated products and ecosystems and thus affect the food chain.
check this book →https://www.dargaud.com/bd-en-ligne/plastic-tac-tic-tac/11632/487ce125c8d7c66938230b5e3ccbbb9e
What is plastic pollution?
Panorama in figures :
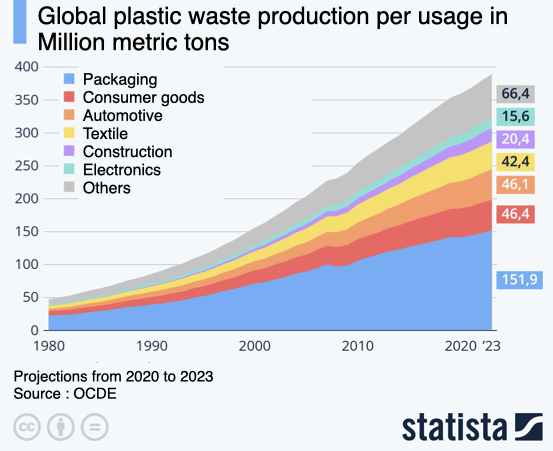
390 million tonnes of plastics will be produced in 2022 (+4% yoy), of which only 8% will come from recycling and 1.5% from bio-plastics.
44% as packaging that rarely lasts more than a year.
In 2019, global plastic production and incineration emitted 850 million tonnes of greenhouse gases, or 3.4% of global greenhouse gases. The world produced the equivalent of 35,000 Eiffel Towers of plastic waste, i.e. 352 million tonnes (this has doubled in 20 years).
50% of this plastic is simply landfilled.
19% is burnt in incinerators
22% is thrown into the countryside, burnt in the open air or in unauthorised dumps
→ Only 9% is recycled
Over 40% of plastic is only used once, before being thrown away. 10 Plastic Facts
Estimates of the lifespan of plastic range from 450 years to infinity. 10 Facts Plastic
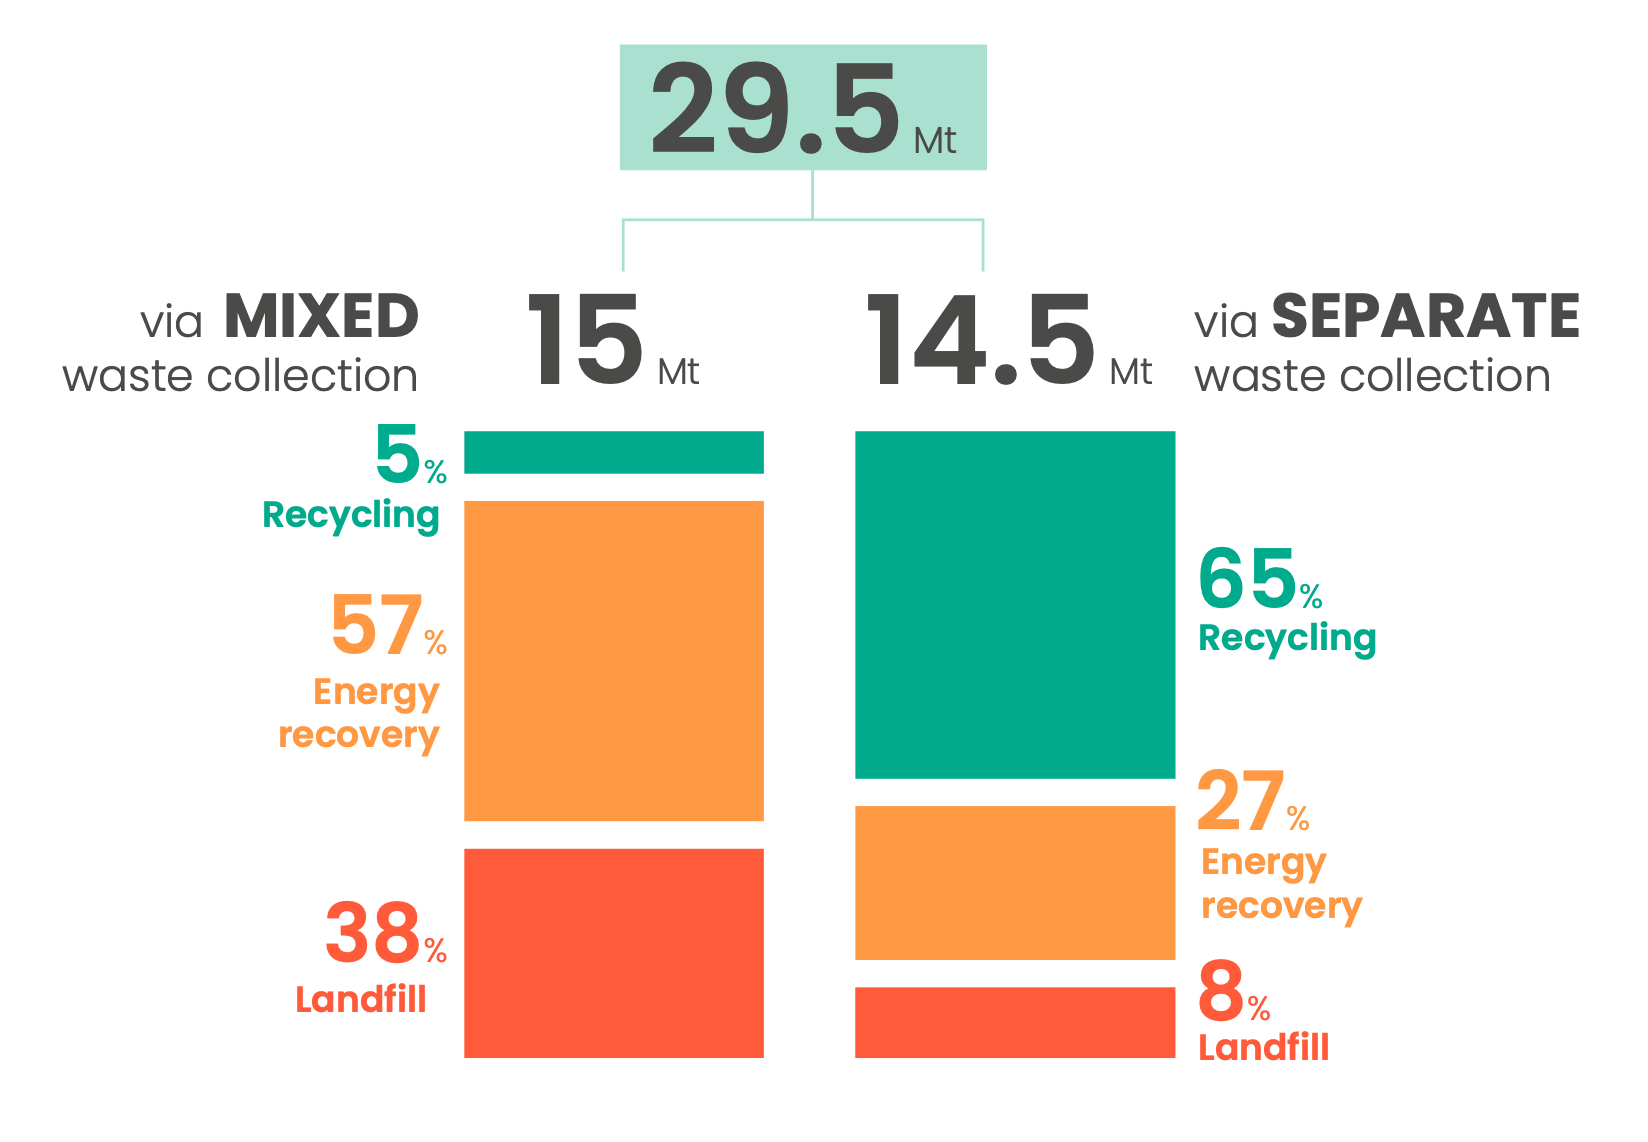
According to plastic producers, one of the main opportunities for improving processing is separate collection, because recovery costs are then lower and recycled plastic becomes more competitive. It is imperative to create incentives for the use of recycled plastic before the use of new materials.
As we have seen, plastics never really disappear, they can only end their life in a treatment centre. However, a third of all plastics end up in the environment, due to a lack of collection in many countries and the dumping of waste in unauthorised dumps or on the streets.
Cigarettes, which are so small, are the most common item of waste found on beaches, and alone pollute 500 litres of water. 23 million cigarette butts are thrown on the ground in France every year, and it is the cigarette that is most often abandoned in the natural environment.
How to get out of it?
On an individual basis: Replacing single-use plastics is essential
For example – the “plastic-free” kit:
For your shopping :
Refuse plastic bags: carry in your pockets or hands or take your cloth bag everywhere.
Think about your packaged purchases, could you avoid them?
Buy in bulk – for example in Hamburg -> https://www.hamburg.de/unverpackt/)
at the drugstores, opt for non-liquid or dissolvable products, which are sold in boxes or cardboard sachets.
For food, opt for the market and cutting stalls where you can bring your own bag or container. Bring back the paper vegetable bags from one week to the next (the merchants will thank you too).
For takeaway coffee – bring your thermos mug
Thirsty? Water bottles save you hundreds of euros a year, because tap water is just as good as bottled water (yes, it is) – in stainless steel, glass or aluminium.
Eating out?
Bring your own container (here is a comparison of lunch boxes),
Do you want delivery? There are also start-ups that help meal delivery companies to be more sustainable and offer containers for exchange.
Plastic straws are already banned in France, but not outside Europe, so drink without a straw or take your own cup with you.
The best thing to do is to eat on the spot or take cutlery with you
Plastic gloves can be replaced by reusable gloves, latex gloves or other more durable alternatives.Les gants en plastique peuvent être remplacés par des gants réutilisables, des gants en latex ou d’autres alternatives plus durables.
Between friends/neighbours:
If you see packaging lying around, pick it up and put it in the containers provided for recycling.
Organising a collection around your home is an opportunity to talk about it and get some fresh air while contributing to everyone’s well-being – contact us if you need help.
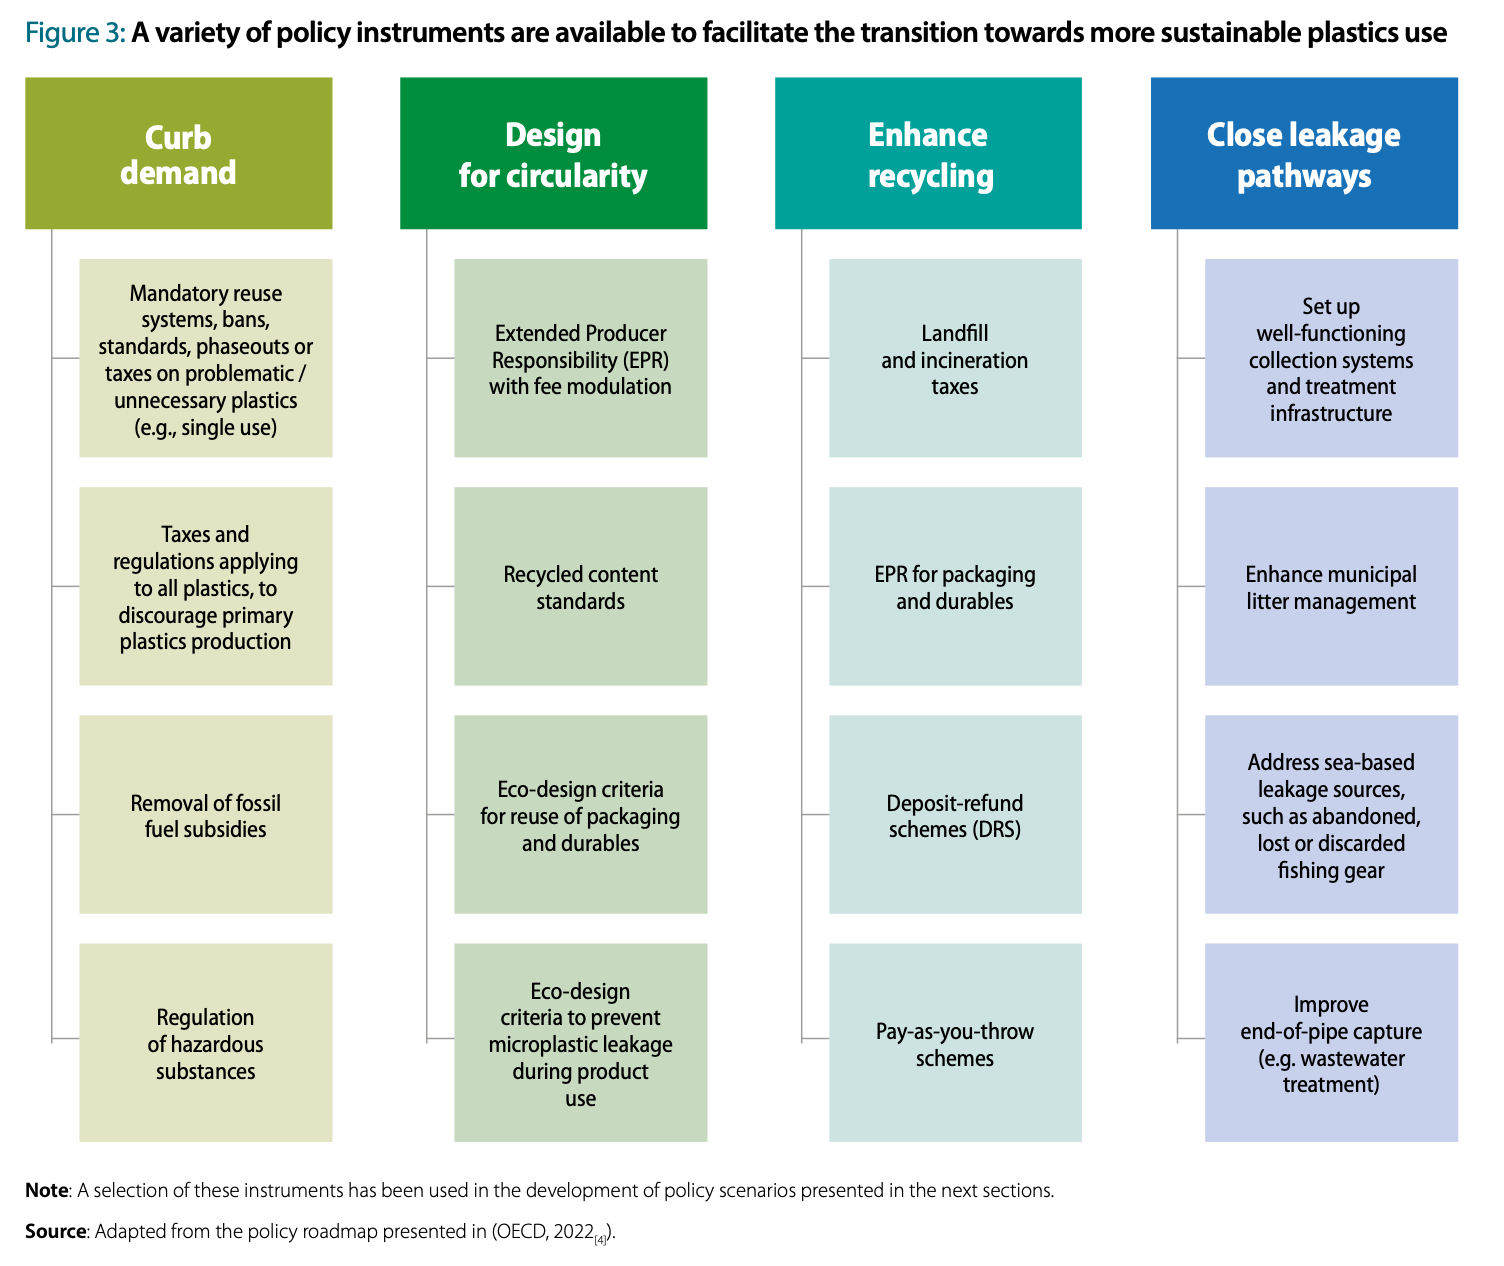
at the level of global policies:
Governments (and in our case the European Union) have enormous power to change markets:
by making the price of single-use plastic prohibitive and alternatives financially attractive
by favouring recycling (by discouraging the use of new materials) and plastic for reusable items only.
by avoiding sending our waste to other countries
by supporting the introduction of waste collection in developing countries
At company level:
There are many issues surrounding plastics :
Taking responsibility for managing the externalities associated with the production and marketing of products containing plastics
use recycled and recyclable packaging, and limit its quantity, especially if it has a short lifespan
think about supply in terms of re-using existing materials rather than new ones
consider ecodesign as part of product development, to integrate end-of-life treatment solutions into products at the design stage, with the potential to reuse them directly in production
take into account the externalities of the product during production: energy requirements, transport,
Awareness campaigns can help to change purchasing behaviour.
There is always hope, for example:
For Instance, the fabricating bioplastics:
Making a bioplastic from potato starch. https://www.youtube.com/watch?v=_9LrdpKwGeg
Bioplastic from milk https://www.youtube.com/watch?v=qSDc0fykIwQ
Bioplastic from marine bacteria https://www.youtube.com/watch?v=THVJ94djTkU
Recycling
Colombia and Ivory Coast https://www.youtube.com/watch?v=OWNA1CjIaIw
Can we do away with plastics? https://www.youtube.com/watch?v=Um3-Pks58PQ
Scenario for eliminating plastics by 2030 https://www.oecd.org/environment/plastics/Interim-Findings-Towards-Eliminating-Plastic-Pollution-by-2040-Policy-Scenario-Analysis.pdf
10 figures on the plastic problem: https://www.nationalgeographic.fr/le-plastique-en-10-chiffres
To continue the deep dive into the topic of the carbon footprint of advertising, we have investigated the status quo on print Audio and Outdoor (OOH) advertising. Both OOH and Audio are more diverse in their formats, infrastructure, and delivery modes, which impacts the capacity to calculate relevant averages or find overarching papers that present dedicated results on these channels. Nevertheless, we hope you find this overview of the abovementioned channels helpful and insightful.
Carbon footprint of printed magazines
Calculating the carbon footprint of a magazine is a tedious task. The life cycle assessment includes paper production, which means you need to know what kind of paper it was and where exactly it was produced, how it was transported to the printing facility and which printing solution was used. Eventually, you also need to take into account the distribution of the copies, both to households and to resellers, and the copies that ended up returning to the production facility for recycling. Obviously, the end of life is another factor, which includes waste sorting and recycling of paper (that can have as many lives as a cat).
In 2010, National Geographic Society conducted a study that showed that the life cycle of the National Geographic magazine produces about 0.82gCO2eq of emissions. But this does not take into account the distribution and the end of life.
In 2010, Mike Berners-Lee did a kitchen study for his book “How bad are the Bananas” (weighing the amount of paper used to produce a magazine or a newspaper and taking into account the end of life). But it does not cover the printing and distribution.
The results were as follows:
300 gCO2eq – the Guardian Weekly, recycled
400 gCO2eq – the Sun, recycled
500 gCO2eq – the Daily Mail, recycled
800 gCO2eq – the Guardian, recycled
1,800 gCO2eq – a ‘quality’ weekend paper, recycled
4,100 gCO2eq – a ‘quality’ weekend paper, sent to landfill
In 2012, the World Association of News Publishers also conducted a relevant study. The main idea of this was to point out which delivery solution (digital vs print) was less harmful for the planet. Is a paper version, maybe shared and kept, better for the planet than its digital equivalent whose consumers have to load the content each time and individually? Although it is impossible to address this issue at a global level, each publisher can take measures locally and provide a clear vision on an individual basis.
Carbon Footprint of Audio advertising
As explained in the last article, the device on which we consume audio (streaming or radio) greatly influences the carbon emissions of the channel.
Radio
For Instance, BBC radio services commissioned a study in 2020 to estimate the energy consumption of each audio device used by the listeners of the BBC radio programs. They found out that using digital TVs (80.6 Wh/device-hour) to listen to the radio is nine times more energy-consuming compared to digital radios or DAB (9.3 Wh/device-hour).
Analogue radio is by far the largest energy-hungry system, essentially AM as the transmitters require a lot of energy but the listenership is limited. As it is made accessible across the land, it basically requires the same amount of energy for one person tuning in as for the entire population.
As part of estimating the carbon impact of this channel, it’s important to take into account the time that relevant devices spend in standby mode: keeping a device connected to the mains 24 hours a day for 2 hours of listening means 22 hours of (reduced but tangible) energy consumption. Turning off the devices could help to save as much as 38.3% of energy, say the researchers.
Music Streaming
According to MQA.co.uk, the environmental cost of today’s streaming-centred music business is twice as high as in the CD era. The current model for digital music is quite wasteful.
This statement is illustrating a common problem with social media: the access to content and its consumption have a really high impact as they depend on the digital infrastructure – which is very energy-hungry – running in the countries with a high carbon share in the energy mix.
When compared to other ways of listening to music, such as using traditional CD/Vinyl players: compact disks and vinyl records (or cassettes for those who are as old as the author) are produced only once and repeatedly played until the medium is worn out. The players themselves consume energy while playing and no infrastructure is “on standby” waiting for the next request.
Various articles found on the internet mention the estimate of 55gCO2eq per hour from the Carbon Trust Paper on video streaming, with the calculation based on the Netflix data usage. It seems commonly accepted that the footprint should be equivalent for both video and audio, but the paper states that when streaming via a cellular network, the volume of data also affects the footprint. This comparison made by the News Statesman illustrates well the above problem.
If we refer to the Kommandotech article, the volume of data required is extremely different depending on the size of the file used as a source from video to audio files:
If we consider the footprint of audio and video should not be considered equivalent then we make an estimate based on the public information made available online. According to the Spotify 2021 Equity & Impact Report,Spotify’s Total GHG Emissions amounted to 353,054 t of CO2eq. in 2021. A quick calculation of the total carbon emissions of Spotify related to end usage and cloud storage in 2021 (36% of the total company carbon footprint ) divided by the volume of minutes consumed (also according to the Spotify website) yields a result close to the average carbon footprint of streaming.
The difference is important and this should not be taken for granted: this estimate does NOT include the device used (production and energy consumption/energy mix of the country), which may represent an important part of the GHG emissions but the author is no researcher to combine different datasets and provide the readers with a final value.
Podcasts
Podcast consumption differs from streaming as it is traditionally downloaded before being listened to. According to Catherine Ho’s paper (see the download link in the list of sources), podcasts tend to be listened to only once, which eventually equates to streaming of the file.
Carbon Footprint of Out Of Home (OOH)
Definition of Out-Of-Home:
In marketing terms, OOH usually includes all activities outside: street displays, urban furniture displays, flyers or sample distribution, events, and mobile displays.
Calculating the carbon footprint is as individualized as the formats made available to advertisers, which makes it important to estimate the impact for each individual campaign depending on the different formats used and the length of the campaign (as well as the length of the video ad for digital).
As OOH advertising is extremely diverse, the type of impacts we are talking about include:
Resources use: for site construction and maintenance.
Plastic use: most large outdoor posters are made of vinyl and can also be attached to objects including buses, planes, buildings, etc.
Electricity use: some large billboards are usually illuminated at night and sometimes during the day, digital screens and rotating billboards are active 24/7.
Paper, printing, and solvent use: when talking about traditional sites (analog city posters), many are still attached manually with glue or placed on a rotating (electric box with light) city board.
Transportation use: delivering paper or vinyl billboards to the posting sites requires road transportation.
In 2008 one of the leaders in the industry, JcDecaux, engaged in an ambitious sustainability strategy to be carbon neutral (including both business and operations) by 2030. With four other major industry players, they built a carbon footprint calculator for the French market with the support of the French trade union of the Outdoor Advertising industry. As we saw in the last article, this only reflects the energy mix (very low carbon energy as nuclear is decarbonated), but it gives an idea of the proportions.
As one can see, digital screens have a larger impact due to the energy necessary to feed the screen. The details of the methodology are explained on the UPE website.
How can companies improve their footprint?
OOH – Tips to improve the carbon footprint of your OOH campaigns:
According to Adquick, Advertisers have a great impact on the evolution of the market as they have the capacity to demand change:
Using recycled and recyclable material and green energy.
Campaigns can be kept up for a longer period of time and repurposed at the end of usage.
Some formats are considered greener than others like Analogue vs Digital Outdoor or transit (buses, taxis) vs mobile (cars dedicated to advertising).
Prioritizing the virtuous operators.
In April this year, the first poster sucking carbon out of the atmosphere was set up in London. This new technology can bring an edge to the sector by offering the possibility to combine advertising and offset the negative environmental impact.
Other OOH companies have grasped the impact of their activity and launched sustainable offers, such as JcDecaux, Jolt, Lamar advertising, Outfront, Ströer, and Volta. It is possible to minimize the footprint of campaigns by requiring that agencies work with sustainable partners.
Audio – Tips to improve your audio usage carbon footprint:
Switch from listening to the radio on a digital TV to a computer or a digital radio.
Download the albums/songs you regularly listen to often or buy a CD if you listen to it more than 27 times.
Stream content that you only listen to once, and do not store past content you do not wish to consume again.
Turn off your devices instead of leaving them in standby mode.
Summary
There are clear opportunities for advertisers to refocus the market toward more sustainable offers for both types of media. Realistically, it is already possible to minimize advertising activities and compensate for any carbon impact by requesting a clear estimate of the campaign impact from your agency and including the cost of compensation in the budget. At the level of individual consumers, end usage based on device is the major cause of the increased impact: choosing wisely the device and network on which to consume the media and remembering to turn the system off when not used could bring a great benefit with no impact on your daily life. Just a habit to kick off – think about it!
Sources
Technology to reduce HQ audio to minimum digital weight – www.MQA.co.uk
Tip to lessen your carbon footprint OOH https://www.adquick.com/blog/six-earth-day-tips-to-lessen-the-carbon-footprint-of-your-ooh-advertising-campaigns/
BBC reports a 1.6 billion tons of greenhouse gas emitted globally in the process of running and serving our digital infrastructure. If we divide it among all internet users worldwide, it means 414 kg of carbon dioxide per user annually => that is the equivalent of driving 3.385 km with a recent car model, which is about one-third of what an average European driver covers in a year.
So yes, this is a LOT and the industry can do more to reduce this impact. Before we present the options, let’s first set the scene.
Content
What do the terms mean?
Which type of media has the largest carbon footprint?
How to compare with others?
What can advertisers do to mitigate their carbon footprint?
What can you do as a consumer of these media to reduce your carbon footprint?
What do the terms “greenhouse gas”, “climate change”, “carbon footprint” and “carbon neutral” mean?
Greenhouse gases (GHGs) are gases that increase the Earth’s temperature due to their absorption of infrared radiation. Although some emissions are natural, the rate at which they are being produced has increased because of human activities (industry, construction, mining, transportation, etc.).The most common GHGs are carbon dioxide (CO2), methane (CH4), nitrous oxide (N2O), and many fluorinated gases.
Climate change: The increase of the Earth’s temperature is the main consequence of changes in our climate that not only raise the external temperature but generate extremeprecipitation and acidification as well as warming of oceans, which changes the cycle of water. Climate change has been occurring since the start of the Industrial Revolution in the 1820s.
Due to humans’ heavy reliance on fossil fuels, energy usage, and constant deforestation, the amount of greenhouse gas in the atmosphere is increasing, which makes greenhouse gas footprint harder to reduce. However, there are several ways to achieve this, for example by choosing more energy-efficient eating habits or household appliances, increasing the usage of fuel-efficient cars, and saving electricity.
Carbon footprint, or GHG footprint: A greenhouse gas footprint is the numerical quantity of the GHGs that a single entity or action emits. It can be calculated at any level of granularity (from individual action or product to the entire planet). The latest climate science findings were published in the IPCC Sixth Assessment Report which explains that the only way to avoid a temperature rise of 1.5 °C or 2 °C is to massively and immediately cut down greenhouse gas emissions.
Carbon neutral: Carbon neutrality means the absence of GHG emissions in the atmosphere. It is generally achieved by avoiding or offsetting carbon emissions.
Which type of media has the largest impact in terms of carbon footprint?
We will start this first part with TV, Video, Display, Print, and Social Media. A second article will follow with Out Of Home, Audio, and Emails.
Carbon footprint estimates are sensitive to many factors:
Type of content: images, music, or videos. Every type of content watched has a different impact as it could be a fully fledged indoor setting with a lot of lighting involved or a reality TV adventure recorded from two small hand cameras or a selfie wheel on TikTok
Type of network: terrestrial, satellite, or mobile
The energy mix of the country where the content is consumed as energy is one of the main drivers of the GHGs emissions in Advertising.
It is important to note that each study has its own method of calculation, and we can only recommend reading the analysis’ methodology behind the provided figures to get the full picture. Now let us take a look at the illustrations of the impact that our industry produces.
Carbon footprint of watching TV
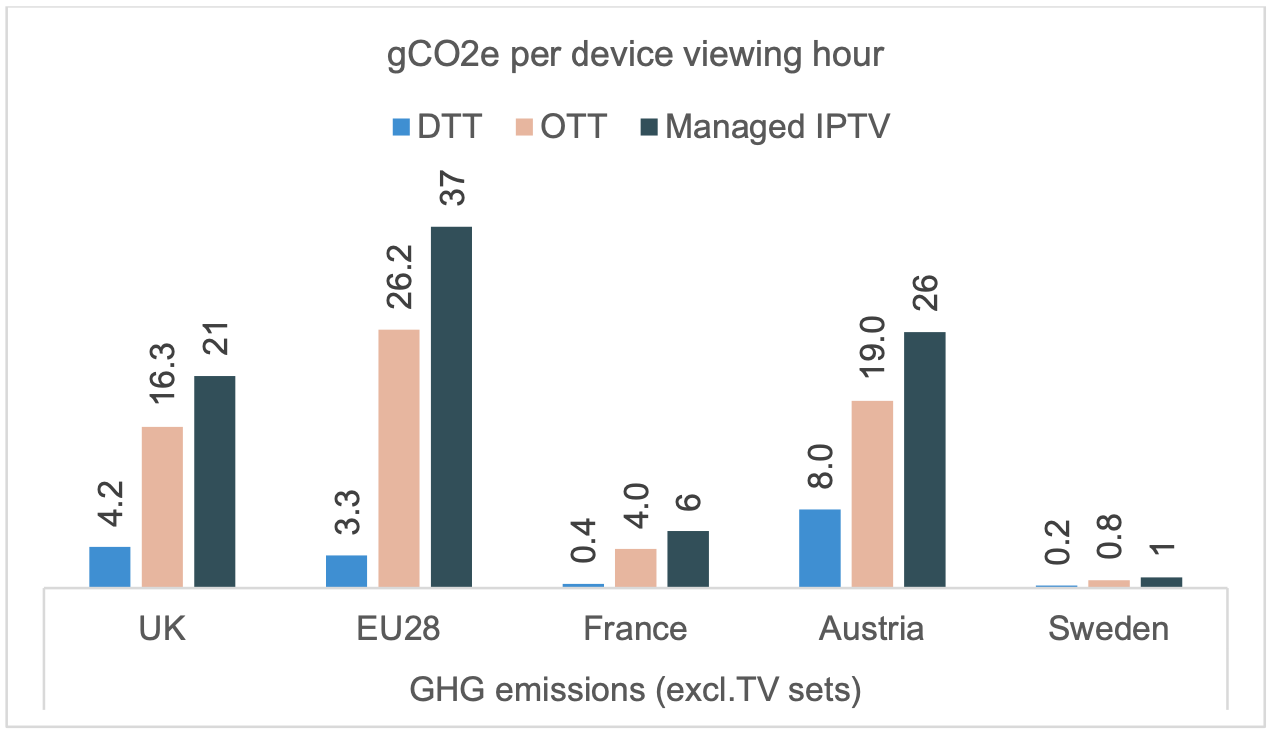
For instance, the 2011 IEEE International Symposium on Sustainable Systems and Technologystudy estimates the carbon footprint of one hour of broadcast TV (terrestrial) at 88 gCO2eq per watcher. The carbon footprint includes both content production (12-35%) and distribution (10-28%) as well as the energy consumed by the TV set => it does not include the production of the TV device itself. A study conducted in 2021 gives the following estimates. It illustrates the great difference between individual European countries, essentially around the energy mix (the high proportion of fossil fuel energy is impacting the emissions drastically). The second factor is the use of internet protocols to serve video content, which requires an energy-hungry infrastructure. These estimates do not take into account the carbon footprint of device production.
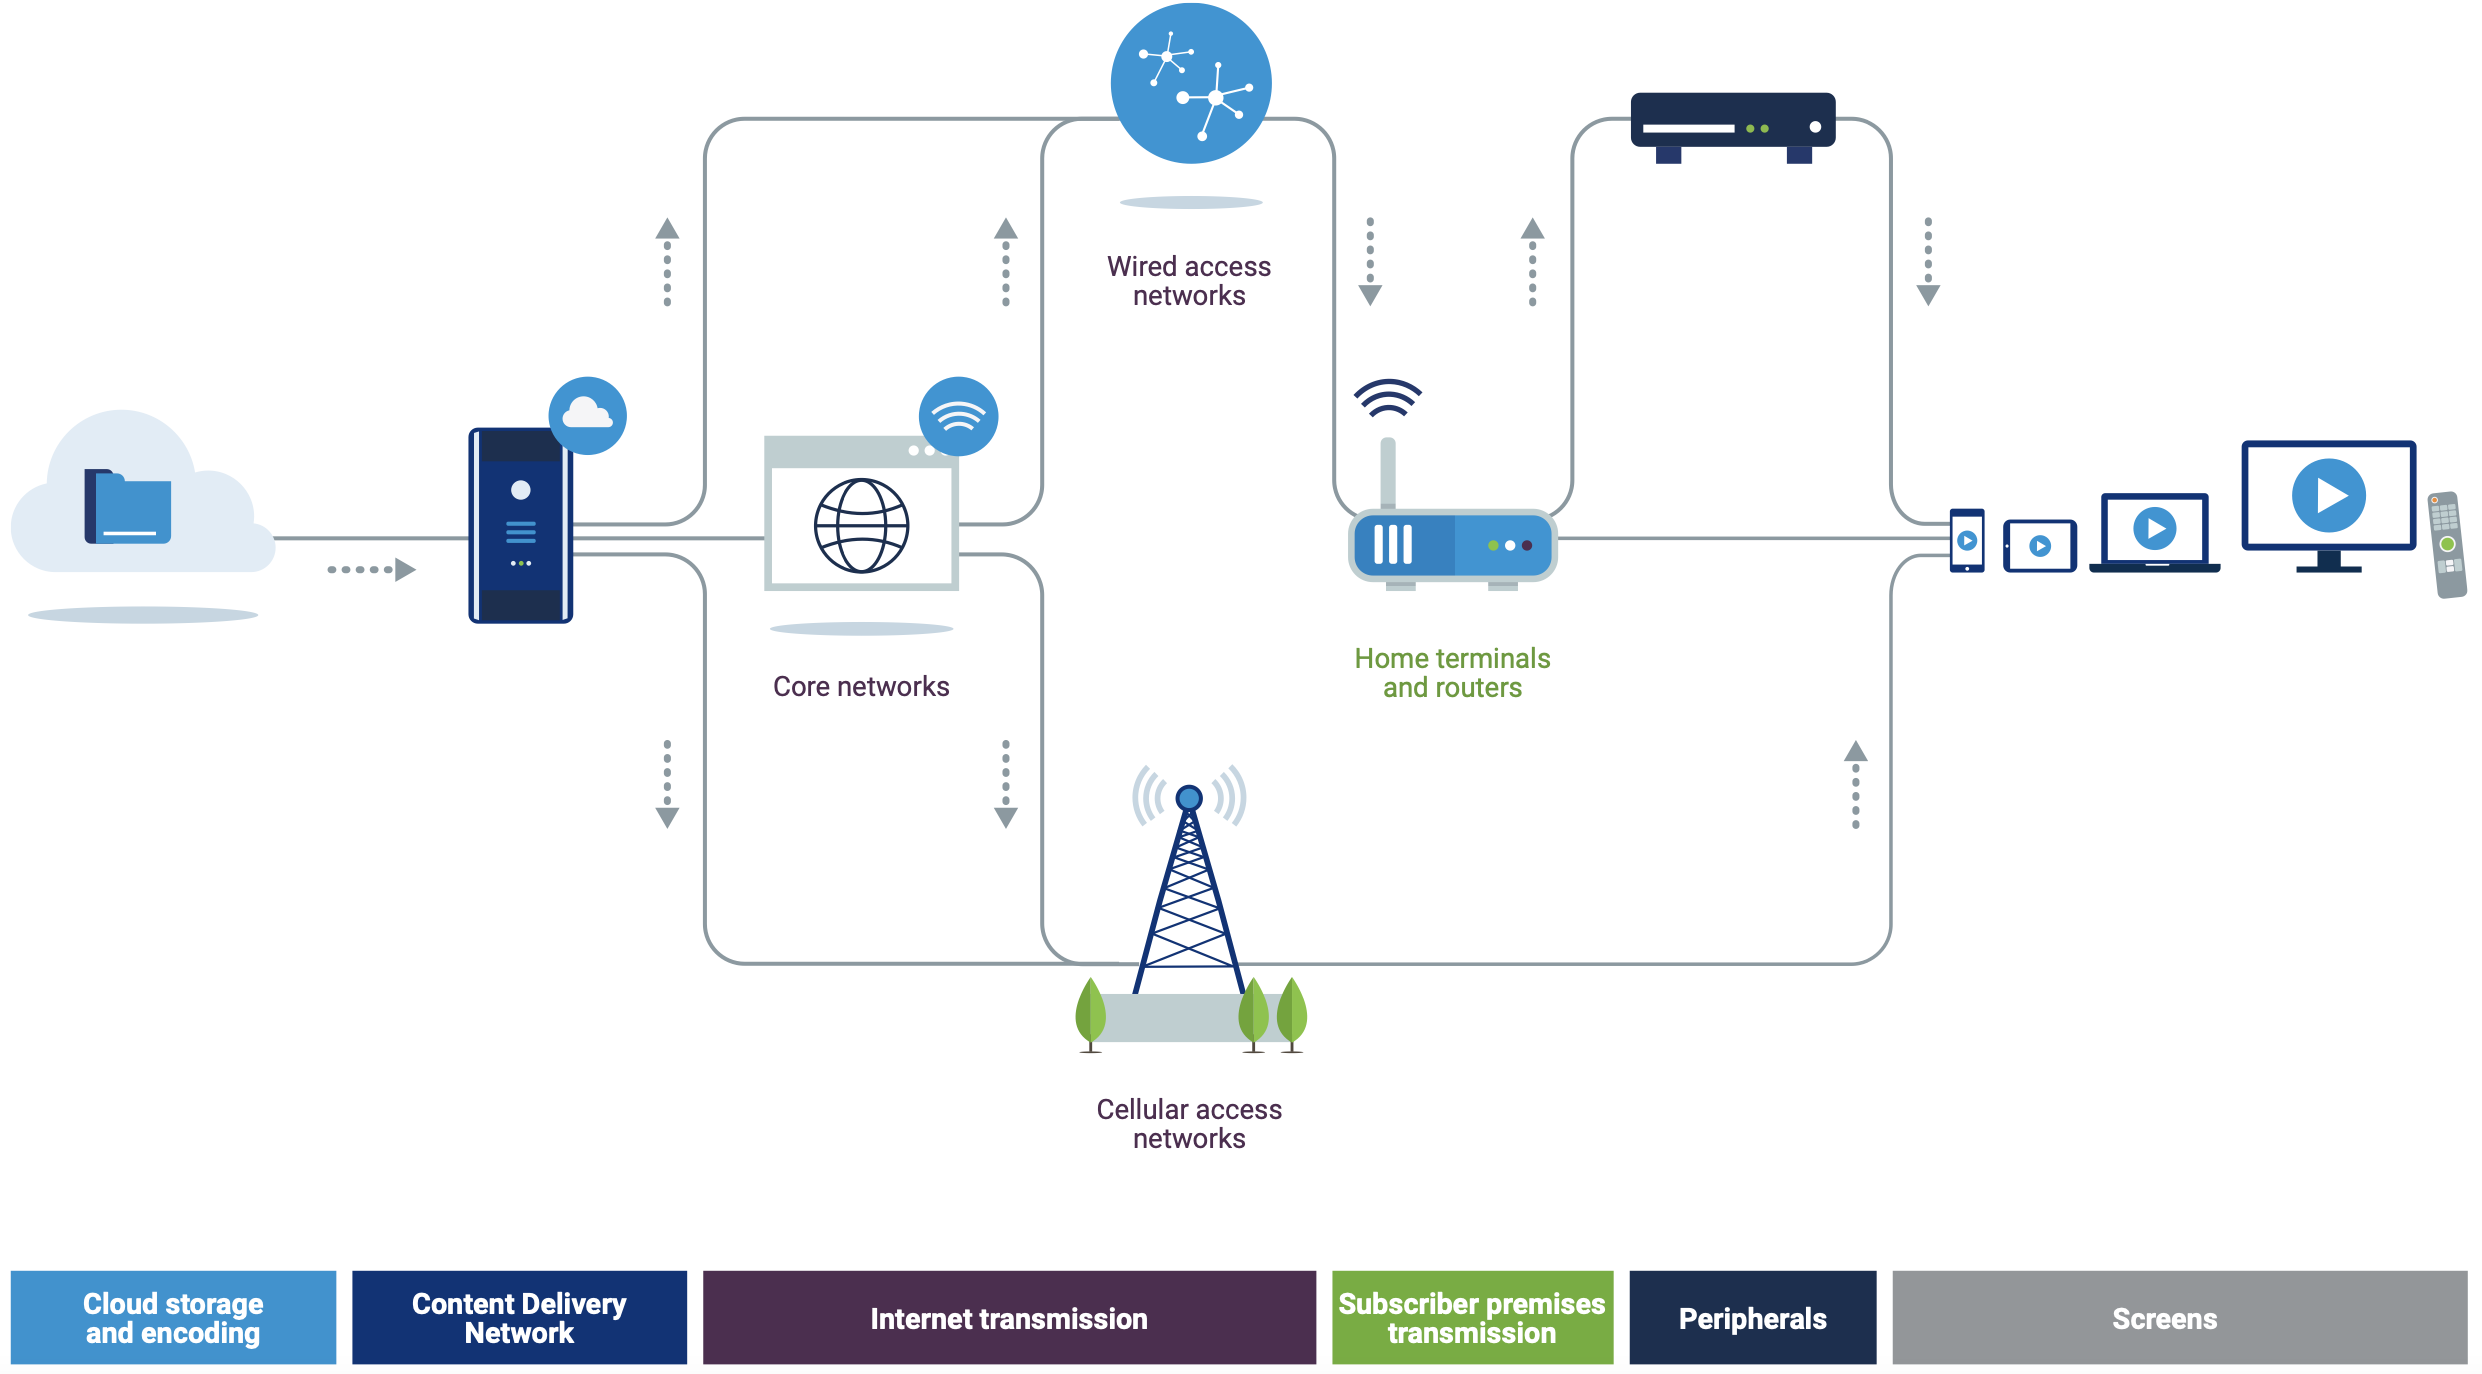
Streaming services such as Netflix, Youtube, Hulu, Prime, or TV+ are served through digital platforms. The Carbon Trust reports an average of around 56gCO2eq per hour of watching.
The Carbon Trust whitepaper includes a good illustration of the steps necessary to serve these services. The team based their estimate on these steps and differentiated taking into account the device connected: mobile, desktop, or TV.
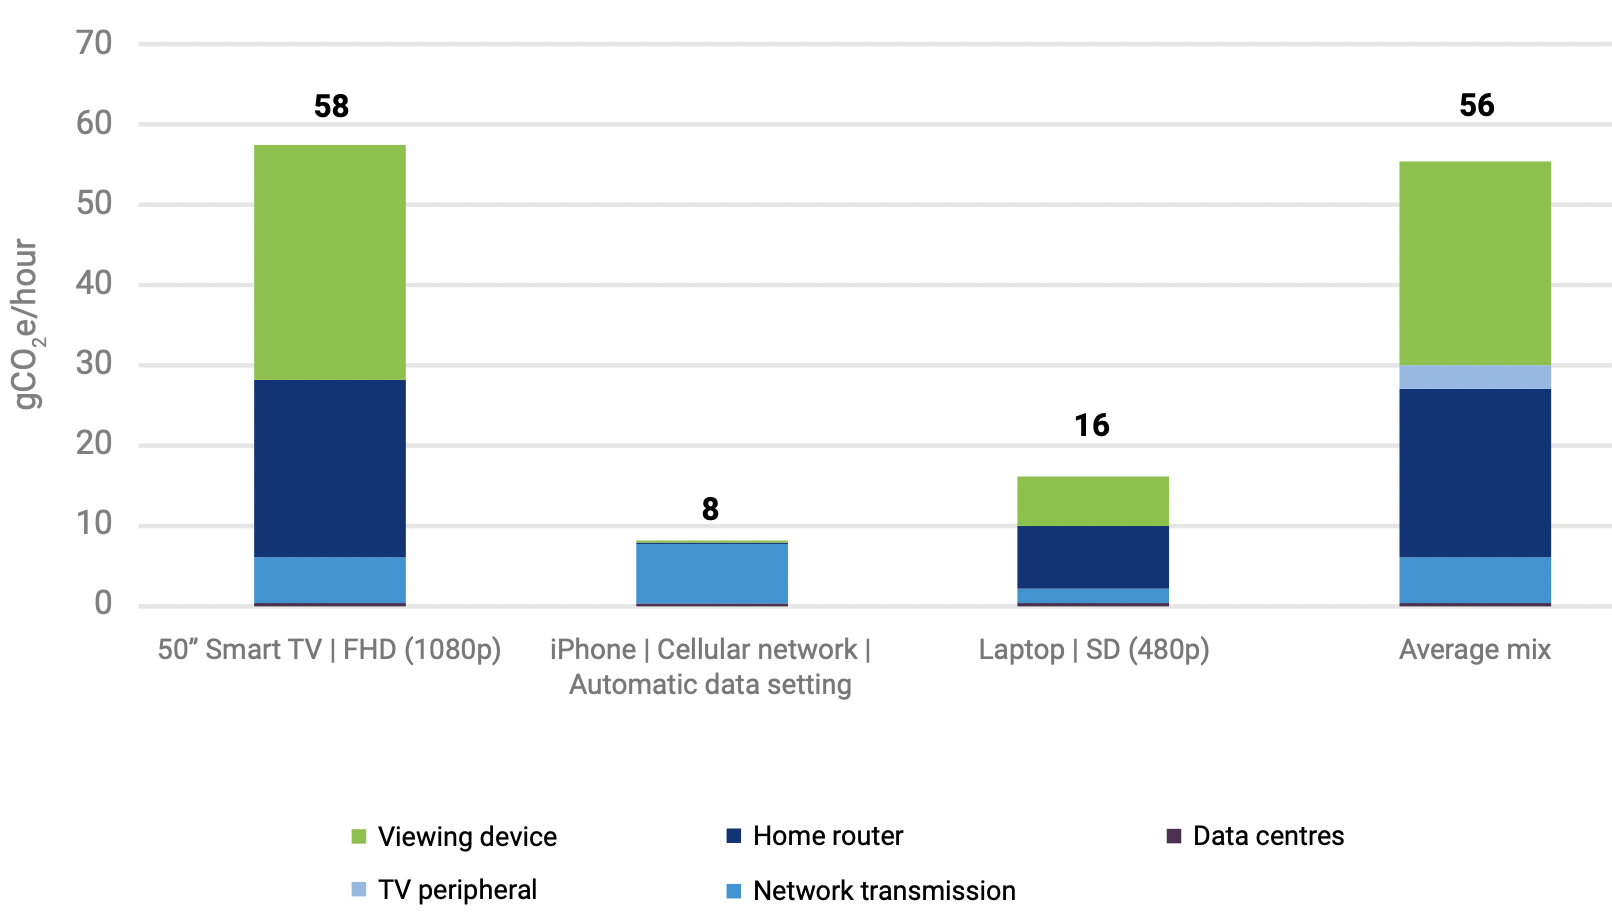
The footprint (related specifically to the energy consumption by the viewing device) of watching content on a 50-inch TV is roughly 4.5 times that of watching on a laptop, and roughly 90 times that of watching on a smartphone. The researchers present the results broken down not only by the type of device but also depending on the quality of the image. The chart below shows how this quality factor actually impacts the GHGs emissions of the devices for different streaming services.
From the Carbon Trust report
The figures for the conventional one indicate clearly that watching streaming services has more impact with smart TVs due to their higher energy consumption (TV sets manufacturing is not taken into account here).
Carbon footprint of Social Media usage on mobile devices
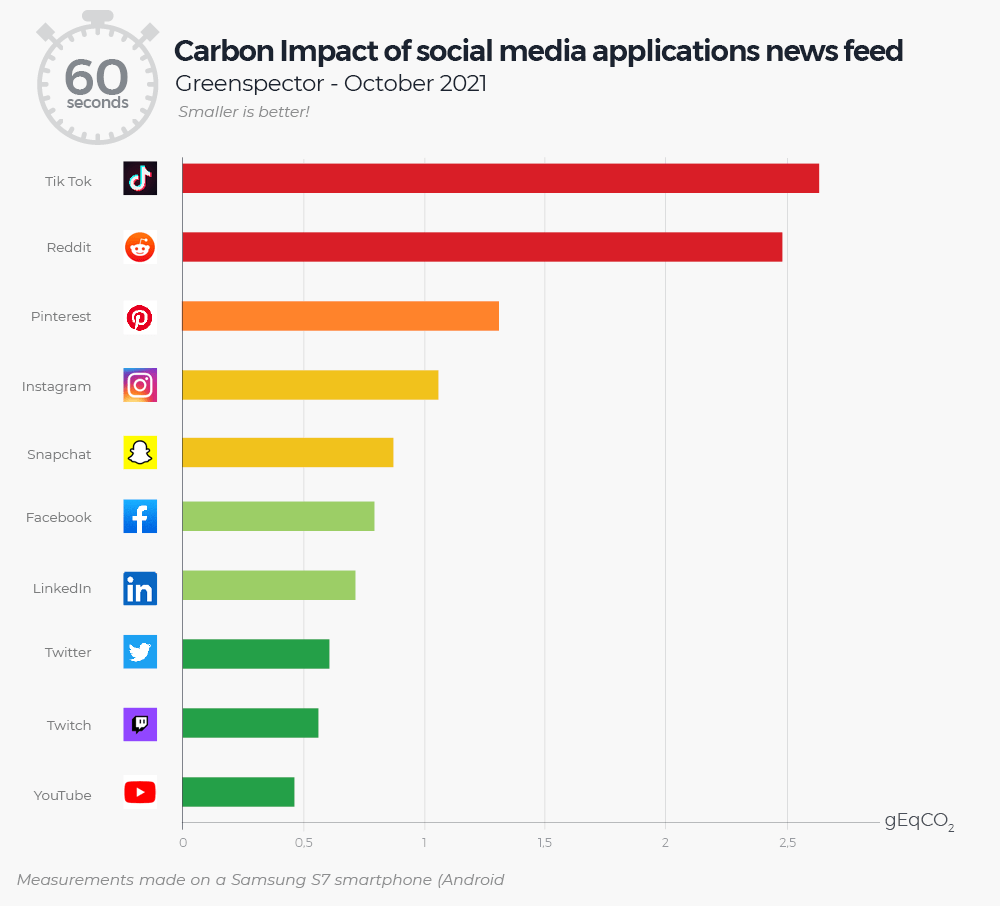
Greenspector published a study in 2021 estimating the gCO2eq per one minute of usage on a Standard Smartphone (Samsung S7) with the staggering figures for TikTok: the estimated emissions reach 2.5gCO2eq per minute of usage versus only 0.46gCO2eq for YouTube (based on the energy mix in France and locations according to the methodology described here).
This translates into 180gCO2eq per hour on TikTok versus 27.6gCO2eq on Youtube.
One factor with a great impact on the outcome of the calculation is the amount of data exchange generated by the consumption of content on mobile devices. As we have seen before, the data flow impacts the overall volume of GHGs emitted.
With an average usage time of over 2 hours daily, Greenspector presents a total estimate of 60kgCO2eq per year per person. So teenagers spending Sundays binge watching (ok, 8 hours is binging for me) TikTok equates to 10km on an airplane.
This study led to the creation of a social media usage calculator that one can check out here.
Carbon footprint of display campaigns
The estimated carbon footprint of a digital campaign, as demonstrated above, depends on the elements we wish to take into account:
Production of the ad (from photo shooting to design)
Transmission of it (data centers and servers) based on creative weight
The platform where it is delivered (social media, publishers’ site on the open web)
Reception (based on the device to view the ad).
One can also argue that it could include:
Website traffic generated by the campaign
Product sales uplift generated by the campaign (in this case, including the carbon footprint of the product or service itself).
Once again, carbon footprint estimation is a really complex topic so the best we can do is scratch the surface and provide a general idea of carbon footprint. There are multiple approaches and methodologies, and each one of them is unique. For instance, Mediacom and CO2Balance developed a carbon calculator for the UK market, covering OOH and digital but omitting data transmission.
In parallel, the Good Loop is offering another model which relies on the energy mix as well as the size (e.g. in MB) and volume of impressions to provide an estimate of digital campaigns’ carbon footprint (considerations and limitations are not indicated).
The calculator estimates that a 15,000,000 impressions campaign using a typical display format (let’s say a medium rectangle – 40 KB) equals 324kgCO2eq of emissions. When this campaign serves 1,500,000 30” video ads weighing 200 MB on Youtube, the carbon footprint reaches 162,000 kgCO2eq, or 162 tons of CO2 equivalent.
How many campaigns have you booked this year?
How to compare with others?
According to The Nature Conservancy, the average carbon footprint for a person in the United States is 16 tCO2eq, one of the highest rates in the world. Globally, the average carbon footprint is closer to 4 tons.
Eurostat reported an average of 6.8tCO2eq per European in 2019.
If you wish to compare yourself to any other benchmarks, do not hesitate to take a look at the Co2 of everything page.
According to Ericsson, the total carbon emissions produced by the Information and Communications Technology (ICT) industry are equivalent to the volume of fuel consumed by the Airlines industry over a year. But the needs of the digital industry and its consumption volumes are growing at a much higher pace.
What can advertisers do to mitigate their carbon footprint?
Although we are living in an increasingly digital world, the ICT sector remains at around 1.4% of the global carbon emissions. Its footprint could be reduced by a staggering 80% if the electricity it consumes came from renewable energy sources instead of fossil fuels.
Generally, there are a few steps that can have a huge positive impact on the environment.
Define low-carbon production guidelines:
For instance, avoid shooting overseas when the team would have to travel by plane:
Limit the digital format weight – reduce the weight by avoiding HD ads or using technology to make your HD videos lighter.
Shorter videos:cutting a 30’’ video down to 15’’ is already dividing your footprint by two.
Compensate carbon emissions beyond the business ones:
As mentioned above, it is possible to compensate for any carbon impact that was already measured, or to decide to attribute a lump sum to offset further impact of the products or services; for instance by dedicating budgets to support innovation in carbon retention or cover beyond the carbon footprint of your own products or services.
Encourage your partners to use green energy:
As advertisers and agencies, you have the power to demand transparency over the energy use and ask providers about their progress in terms of emissions reduction. Every participant of this sector can start moving in the right direction, as The Trade Desk claims in the article they published a few days ago. Stewardship is a very efficient way to mitigate the overall impact of the industry, and it is essential that every actor practise a conscious approach.
What can you do as a consumer of these media to reduce your carbon footprint?
Watch less video on the go – better view the videos when you are connected to WiFi.
Change your mobile phone settings to a lower video resolution (SD versus 4k).
Cancel autoplay of videos and close browser windows running videos in case they stay in the background.