BBC reports a 1.6 billion tons of greenhouse gas emitted globally in the process of running and serving our digital infrastructure. If we divide it among all internet users worldwide, it means 414 kg of carbon dioxide per user annually => that is the equivalent of driving 3.385 km with a recent car model, which is about one-third of what an average European driver covers in a year.
So yes, this is a LOT and the industry can do more to reduce this impact. Before we present the options, let’s first set the scene.
Content
- What do the terms mean?
- Which type of media has the largest carbon footprint?
- How to compare with others?
- What can advertisers do to mitigate their carbon footprint?
- What can you do as a consumer of these media to reduce your carbon footprint?
What do the terms “greenhouse gas”, “climate change”, “carbon footprint” and “carbon neutral” mean?
Greenhouse gases (GHGs) are gases that increase the Earth’s temperature due to their absorption of infrared radiation. Although some emissions are natural, the rate at which they are being produced has increased because of human activities (industry, construction, mining, transportation, etc.).The most common GHGs are carbon dioxide (CO2), methane (CH4), nitrous oxide (N2O), and many fluorinated gases.
Climate change: The increase of the Earth’s temperature is the main consequence of changes in our climate that not only raise the external temperature but generate extreme precipitation and acidification as well as warming of oceans, which changes the cycle of water. Climate change has been occurring since the start of the Industrial Revolution in the 1820s.
Due to humans’ heavy reliance on fossil fuels, energy usage, and constant deforestation, the amount of greenhouse gas in the atmosphere is increasing, which makes greenhouse gas footprint harder to reduce. However, there are several ways to achieve this, for example by choosing more energy-efficient eating habits or household appliances, increasing the usage of fuel-efficient cars, and saving electricity.
Carbon footprint, or GHG footprint: A greenhouse gas footprint is the numerical quantity of the GHGs that a single entity or action emits. It can be calculated at any level of granularity (from individual action or product to the entire planet). The latest climate science findings were published in the IPCC Sixth Assessment Report which explains that the only way to avoid a temperature rise of 1.5 °C or 2 °C is to massively and immediately cut down greenhouse gas emissions.
Carbon neutral: Carbon neutrality means the absence of GHG emissions in the atmosphere. It is generally achieved by avoiding or offsetting carbon emissions.
Which type of media has the largest impact in terms of carbon footprint?
We will start this first part with TV, Video, Display, Print, and Social Media. A second article will follow with Out Of Home, Audio, and Emails.
Carbon footprint estimates are sensitive to many factors:
- Type of content: images, music, or videos. Every type of content watched has a different impact as it could be a fully fledged indoor setting with a lot of lighting involved or a reality TV adventure recorded from two small hand cameras or a selfie wheel on TikTok
- Type of network: terrestrial, satellite, or mobile
- The energy mix of the country where the content is consumed as energy is one of the main drivers of the GHGs emissions in Advertising.
It is important to note that each study has its own method of calculation, and we can only recommend reading the analysis’ methodology behind the provided figures to get the full picture. Now let us take a look at the illustrations of the impact that our industry produces.
Carbon footprint of watching TV
For instance, the 2011 IEEE International Symposium on Sustainable Systems and Technology study estimates the carbon footprint of one hour of broadcast TV (terrestrial) at 88 gCO2eq per watcher. The carbon footprint includes both content production (12-35%) and distribution (10-28%) as well as the energy consumed by the TV set => it does not include the production of the TV device itself.
A study conducted in 2021 gives the following estimates. It illustrates the great difference between individual European countries, essentially around the energy mix (the high proportion of fossil fuel energy is impacting the emissions drastically). The second factor is the use of internet protocols to serve video content, which requires an energy-hungry infrastructure. These estimates do not take into account the carbon footprint of device production.
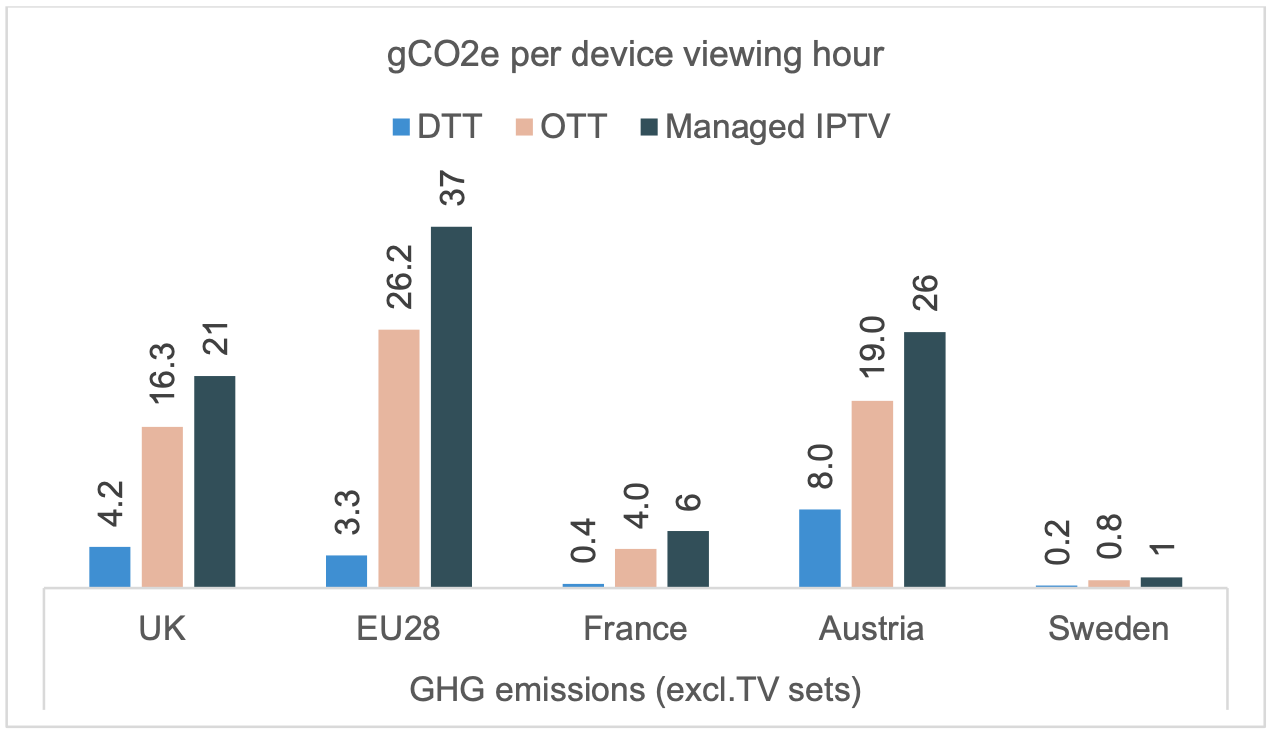
- Digital Terrestrial Television (DTT)
- Over-the-top (OTT)
- Managed Internet Protocol Television (IPTV)
Carbon footprint of watching streaming services
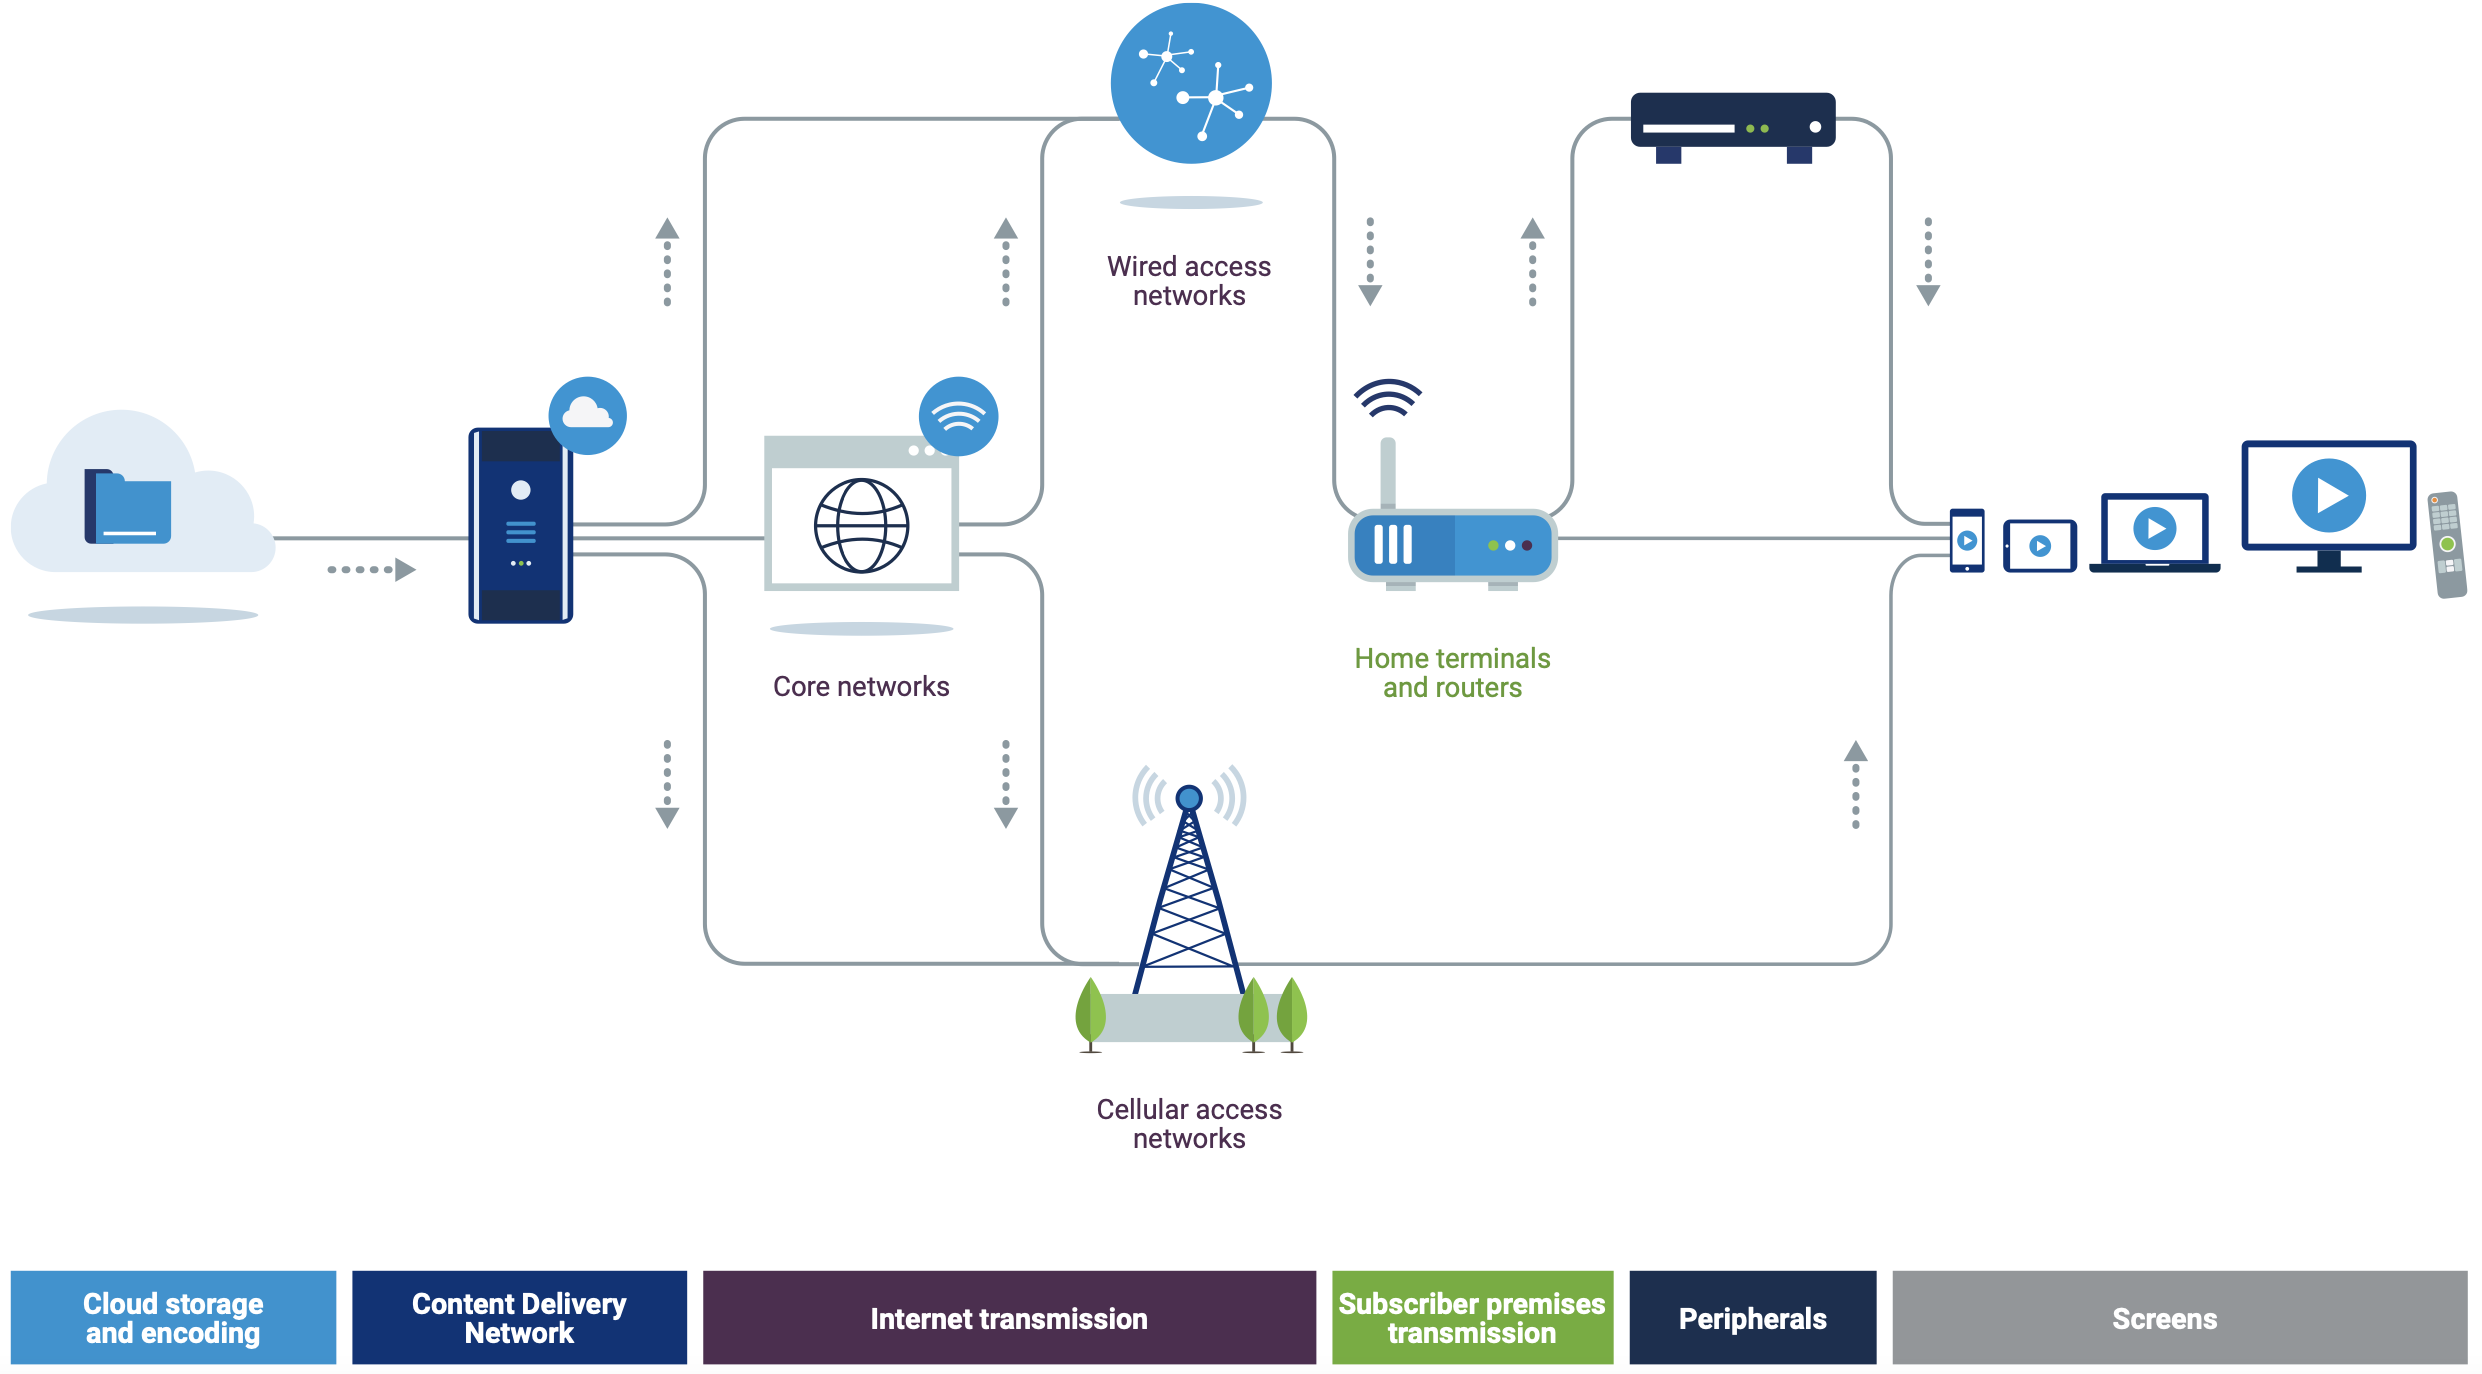
Streaming services such as Netflix, Youtube, Hulu, Prime, or TV+ are served through digital platforms. The Carbon Trust reports an average of around 56gCO2eq per hour of watching.
The Carbon Trust whitepaper includes a good illustration of the steps necessary to serve these services. The team based their estimate on these steps and differentiated taking into account the device connected: mobile, desktop, or TV.
The footprint (related specifically to the energy consumption by the viewing device) of watching content on a 50-inch TV is roughly 4.5 times that of watching on a laptop, and roughly 90 times that of watching on a smartphone. The researchers present the results broken down not only by the type of device but also depending on the quality of the image. The chart below shows how this quality factor actually impacts the GHGs emissions of the devices for different streaming services.
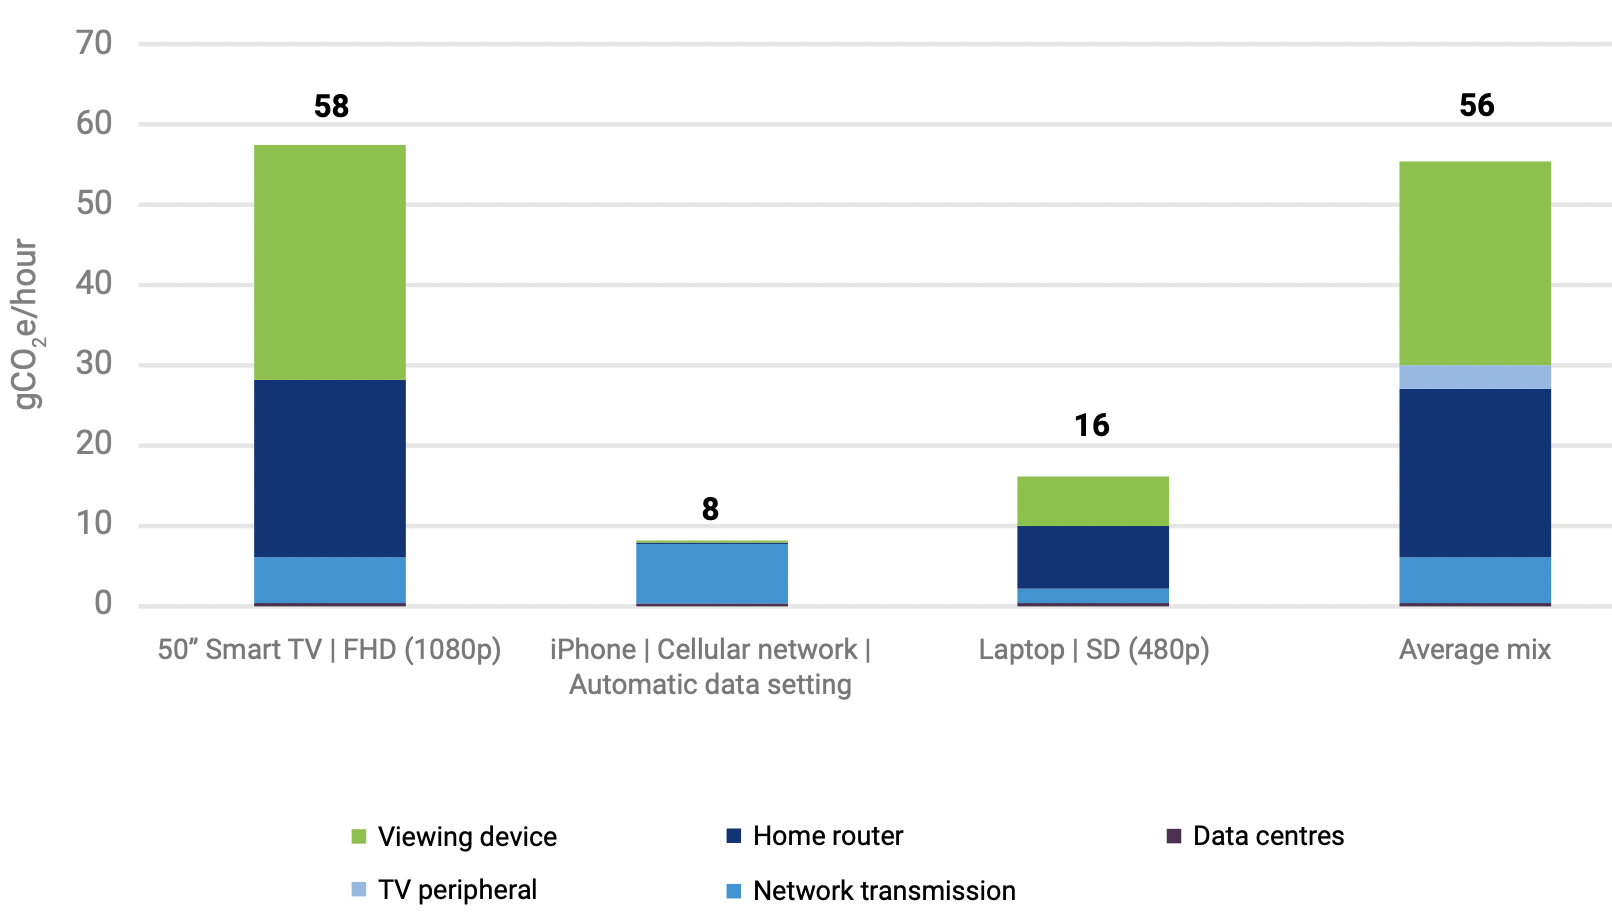
The figures for the conventional one indicate clearly that watching streaming services has more impact with smart TVs due to their higher energy consumption (TV sets manufacturing is not taken into account here).
Carbon footprint of Social Media usage on mobile devices
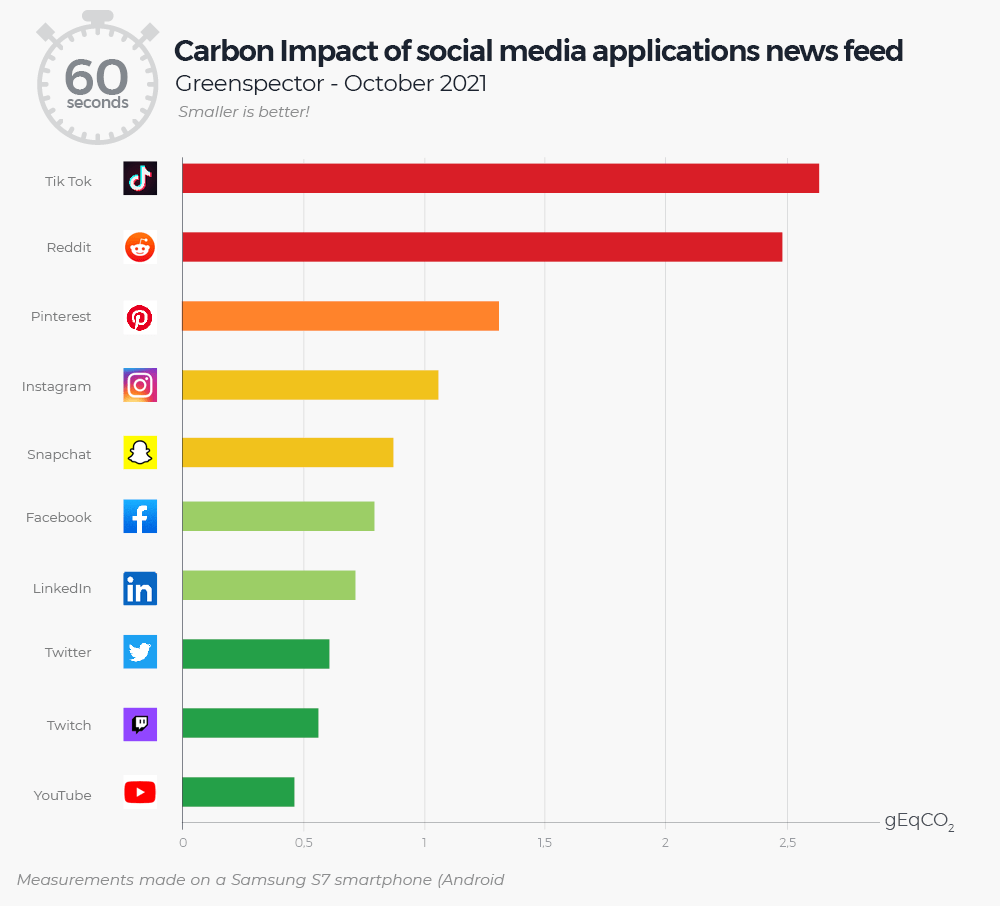
Greenspector published a study in 2021 estimating the gCO2eq per one minute of usage on a Standard Smartphone (Samsung S7) with the staggering figures for TikTok: the estimated emissions reach 2.5gCO2eq per minute of usage versus only 0.46gCO2eq for YouTube (based on the energy mix in France and locations according to the methodology described here).
This translates into 180gCO2eq per hour on TikTok versus 27.6gCO2eq on Youtube.
One factor with a great impact on the outcome of the calculation is the amount of data exchange generated by the consumption of content on mobile devices. As we have seen before, the data flow impacts the overall volume of GHGs emitted.
With an average usage time of over 2 hours daily, Greenspector presents a total estimate of 60kgCO2eq per year per person. So teenagers spending Sundays binge watching (ok, 8 hours is binging for me) TikTok equates to 10km on an airplane.
This study led to the creation of a social media usage calculator that one can check out here.
Carbon footprint of display campaigns
The estimated carbon footprint of a digital campaign, as demonstrated above, depends on the elements we wish to take into account:
- Production of the ad (from photo shooting to design)
- Transmission of it (data centers and servers) based on creative weight
- The platform where it is delivered (social media, publishers’ site on the open web)
- Reception (based on the device to view the ad).
One can also argue that it could include:
- Website traffic generated by the campaign
- Product sales uplift generated by the campaign (in this case, including the carbon footprint of the product or service itself).
Once again, carbon footprint estimation is a really complex topic so the best we can do is scratch the surface and provide a general idea of carbon footprint. There are multiple approaches and methodologies, and each one of them is unique. For instance, Mediacom and CO2Balance developed a carbon calculator for the UK market, covering OOH and digital but omitting data transmission.
In parallel, the Good Loop is offering another model which relies on the energy mix as well as the size (e.g. in MB) and volume of impressions to provide an estimate of digital campaigns’ carbon footprint (considerations and limitations are not indicated).
The calculator estimates that a 15,000,000 impressions campaign using a typical display format (let’s say a medium rectangle – 40 KB) equals 324kgCO2eq of emissions. When this campaign serves 1,500,000 30” video ads weighing 200 MB on Youtube, the carbon footprint reaches 162,000 kgCO2eq, or 162 tons of CO2 equivalent.
How many campaigns have you booked this year?
How to compare with others?
According to The Nature Conservancy, the average carbon footprint for a person in the United States is 16 tCO2eq, one of the highest rates in the world. Globally, the average carbon footprint is closer to 4 tons.
Eurostat reported an average of 6.8tCO2eq per European in 2019.
If you wish to compare yourself to any other benchmarks, do not hesitate to take a look at the Co2 of everything page.
According to Ericsson, the total carbon emissions produced by the Information and Communications Technology (ICT) industry are equivalent to the volume of fuel consumed by the Airlines industry over a year. But the needs of the digital industry and its consumption volumes are growing at a much higher pace.
What can advertisers do to mitigate their carbon footprint?
Although we are living in an increasingly digital world, the ICT sector remains at around 1.4% of the global carbon emissions. Its footprint could be reduced by a staggering 80% if the electricity it consumes came from renewable energy sources instead of fossil fuels.
Generally, there are a few steps that can have a huge positive impact on the environment.
- Define low-carbon production guidelines:
For instance, avoid shooting overseas when the team would have to travel by plane:
- => hire a local team and work with them remotely
- => shoot in your country of origin
- => international brands can localise shooting.
- Reduce the weight of creatives: The Shift Project has developed guidelines on how to reduce the weight of any videos. It applies to advertising as well:
- Limit the digital format weight – reduce the weight by avoiding HD ads or using technology to make your HD videos lighter.
- Shorter videos: cutting a 30’’ video down to 15’’ is already dividing your footprint by two.
- Compensate carbon emissions beyond the business ones:
As mentioned above, it is possible to compensate for any carbon impact that was already measured, or to decide to attribute a lump sum to offset further impact of the products or services; for instance by dedicating budgets to support innovation in carbon retention or cover beyond the carbon footprint of your own products or services.
- Encourage your partners to use green energy:
As advertisers and agencies, you have the power to demand transparency over the energy use and ask providers about their progress in terms of emissions reduction. Every participant of this sector can start moving in the right direction, as The Trade Desk claims in the article they published a few days ago. Stewardship is a very efficient way to mitigate the overall impact of the industry, and it is essential that every actor practise a conscious approach.
What can you do as a consumer of these media to reduce your carbon footprint?
- Watch less video on the go – better view the videos when you are connected to WiFi.
- Change your mobile phone settings to a lower video resolution (SD versus 4k).
- Cancel autoplay of videos and close browser windows running videos in case they stay in the background.
- Turn off your devices at the end of the day.
- Give yourself some “flight mode” breaks,
- Why not erase your social apps from your phone
Leave a Reply